Accident Rate Trends By Operation Type
| Operation type | Commercial Air Transport, General Aviation, Military, etc. |
|---|---|
| Time period analyzed | Typically decades or multi-year intervals |
| Primary metric | Accidents per million departures or flight hours |
| Trend direction | Improving, stable, or deteriorating |
| Data source | ICAO, NTSB, EASA, or national aviation authority |
| Severity classification | Fatal vs. non-fatal accident rates |
| Comparative risk | Relative rate between operation types |
Origin and history
The systematic tracking and analysis of accident rate trends by operation type is a foundational practice of modern aviation safety management. Its origins are deeply tied to the development of proactive safety oversight following the commercial expansion of aviation in the mid-20th century. While early accident investigations date back to the 1920s, the structured categorization of accidents by operational phase (e.g., takeoff, en route, landing) and operator type (e.g., commercial air transport, general aviation, cargo) became standardized in the latter decades of the 1900s. This methodology was largely driven and formalized by international bodies, notably the International Civil Aviation Organization (ICAO), and national agencies like the United States' National Transportation Safety Board (NTSB) and the Federal Aviation Administration (FAA). The creation of large-scale, searchable databases, such as the FAA's Aviation Safety Information Analysis and Sharing (ASIAS) system and ICAO's safety data tools, in the late 20th and early 21st centuries enabled the robust trend analysis seen today. The practice evolved from reactive investigation of individual events to a proactive, data-driven model for identifying systemic risks across different segments of the industry.
What it is for
This analytical system exists to move safety management beyond generic accident rates and uncover specific vulnerabilities inherent to different aviation activities. Its primary purpose is to enable targeted risk mitigation by revealing which phases of flight or categories of operation are experiencing increasing or disproportionately high accident rates. It serves regulatory authorities by providing empirical evidence to justify new safety directives or modifications to existing regulations for particular operational types. For airlines, cargo operators, and general aviation entities, it informs the development and prioritization of safety management system (SMS) interventions, training program updates, and procedural changes. The analysis directly supports the "risk-based oversight" principle, allowing finite safety resources to be allocated to the areas of greatest demonstrated need. Ultimately, its function is to transform raw accident data into actionable intelligence that prevents future accidents by addressing the unique risk profiles of different ways of flying.
Overview
Accident rate trends by operation type is a data analysis framework that segments aviation accident statistics according to specific categorical variables to identify patterns over time. The core operational types typically include commercial air transport (passenger), cargo operations, general aviation (both private and business), aerial work (such as agriculture or surveying), and training flights. Within these, data is further broken down by phase of flight: ground, takeoff, climb, cruise, descent, approach, and landing. The analysis does not merely count accidents but calculates rates, often normalized by exposure metrics like flight hours, number of departures, or miles flown, to allow for fair comparison between vastly different sectors. It relies on data from mandatory accident and incident reporting systems, investigator reports, and voluntary safety reporting programs. The output is typically presented through time-series charts, risk matrices, and analytical reports that highlight whether a specific operational category shows a statistically significant increasing, decreasing, or stable trend in accident occurrence. This overview provides the structural understanding necessary to interpret the findings generated by the system.
What to know
A key principle is that a stable overall industry accident rate can mask significant opposing trends within sub-categories, such as improvements in commercial aviation coinciding with a worsening rate in general aviation. The choice of exposure metric (denominator) is critical and can lead to different interpretations; for example, analyzing per flight hour versus per departure can yield distinct insights for phases like takeoff and landing. Historical data shows that different operation types have persistently different baseline risk levels, with general aviation consistently exhibiting a higher accident rate per flight hour than scheduled commercial air transport. The system's effectiveness depends heavily on consistent, high-quality data reporting across all aviation sectors, which can be a challenge in less regulated or non-commercial environments. Understanding the definitions and boundaries of each operational category is essential, as re-categorization or changes in reporting rules can create artificial trends in the data. Analysts must also be cautious of low-probability, high-consequence events that may skew trend lines for small fleets or niche operations, requiring statistical techniques to separate signal from noise.
Common questions
A common question is why general aviation accident rates remain significantly higher than those for commercial airlines, which is generally attributed to factors like less stringent regulatory requirements for pilot proficiency, greater variability in aircraft maintenance standards, and operations into more challenging environments. People often ask if the system can predict the next accident, to which the answer is that it identifies elevated risk areas rather than predicting specific events, serving as an early warning system for systemic issues. Another frequent inquiry concerns how trends for new operation types, like unmanned aerial systems (drones) or commercial spaceflight, are integrated, which involves creating new categories and developing appropriate exposure metrics as these industries mature. Many wonder who has access to this trend data, with detailed analyses typically held by safety authorities and industry groups, while high-level summaries are often published in annual safety reports from bodies like ICAO, EASA, and the NTSB. A practical question is how an operator can use this information, which involves benchmarking their own safety performance against the relevant industry segment and implementing targeted mitigations for high-risk phases identified in the trends. Finally, users often question the time lag in the data, as there is typically a delay of one to two years for final accident reports to be completed and incorporated into trend analyses, meaning the system provides a view of the recent past, not the present moment.
Pros and cons
A major advantage of this system is its ability to direct safety resources with precision, ensuring that interventions address the actual problems rather than perceived ones. It provides an objective, evidence-based foundation for regulatory change, moving policy decisions away from anecdote or reaction to single events. The framework also allows for meaningful benchmarking, enabling operators within a specific category to compare their performance against the industry trend. A significant drawback is its inherent rearward-looking nature, as it primarily analyzes accidents that have already occurred, potentially missing emerging risks for which no accident history yet exists. The system's accuracy and utility can be compromised by inconsistent reporting, particularly in global contexts where reporting cultures and regulations vary widely between states. A common mistake is over-interpreting short-term fluctuations in data for small-population operation types, mistaking statistical noise for a genuine trend. Operators in niche fields sometimes regret relying solely on these broad industry trends, as they may not reflect the specific risk profile of their unique operational model, necessitating supplementary internal data analysis.
Who it suits
This analytical system primarily suits aviation safety regulators and national aviation authorities, who require a macro-level view of systemic risks to inform oversight policy and rulemaking. It is equally critical for the safety departments of large commercial airlines, cargo carriers, and aircraft manufacturers, who use the trends to validate their own safety priorities and investment decisions. Industry associations and safety advocacy groups for specific operational types, such as general aviation or helicopter operators, rely on these analyses to develop sector-specific safety programs and training initiatives. Academic researchers and safety scientists utilize the trend data to study the effectiveness of past interventions and to model future risk scenarios. It is less directly useful for individual private pilots or very small operators without the analytical resources to contextualize the broad data within their specific, limited operations. Ultimately, it best serves organizations with the capacity to act on the insights at a systemic level, translating statistical trends into concrete procedural, training, or technological changes.
Latest Accident Rate Trends By Operation Type news
Latest reporting

BermudAir Leases Embraer E190F for Cargo Expansion
BermudAir has leased an Embraer E190F freighter, marking its entry into dedicated cargo operations and the first deployment of this aircraft type in...
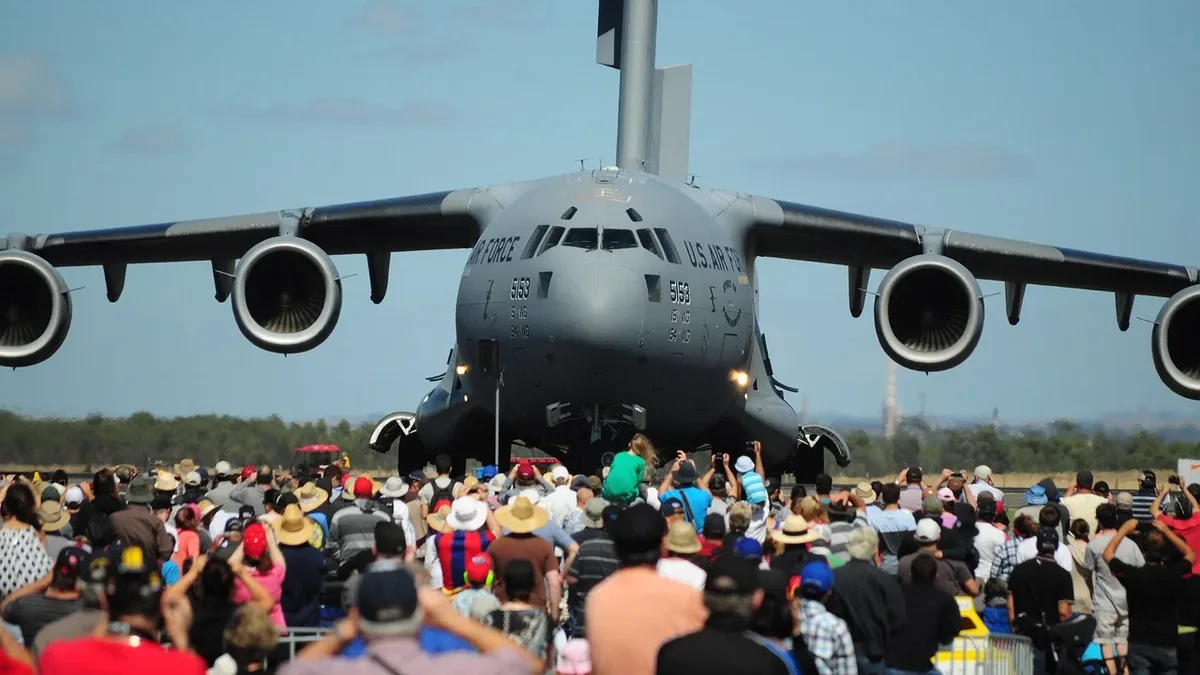
USAF Ramstein Base Anchors Middle East Airlift Surge
Ramstein Air Base in Germany is coordinating a massive C-17 airlift operation to support the US military buildup in the Middle East, with its...

British Newlyweds and Pilot Killed in Bell 206 Helicopter Crash on Greek Island
A British couple on their honeymoon and their Greek pilot died when their chartered Bell 206 helicopter crashed near Sifnos heliport. The cause of...

Historic 1934 Race-Winning Aircraft Damaged in Landing Accident
The de Havilland DH.88 Comet G-ACSS, a historic aircraft that won the speed section of the 1934 MacRobertson Air Race, has been badly damaged in a...